Train–Test Split (Hold-Out Method)
Definition
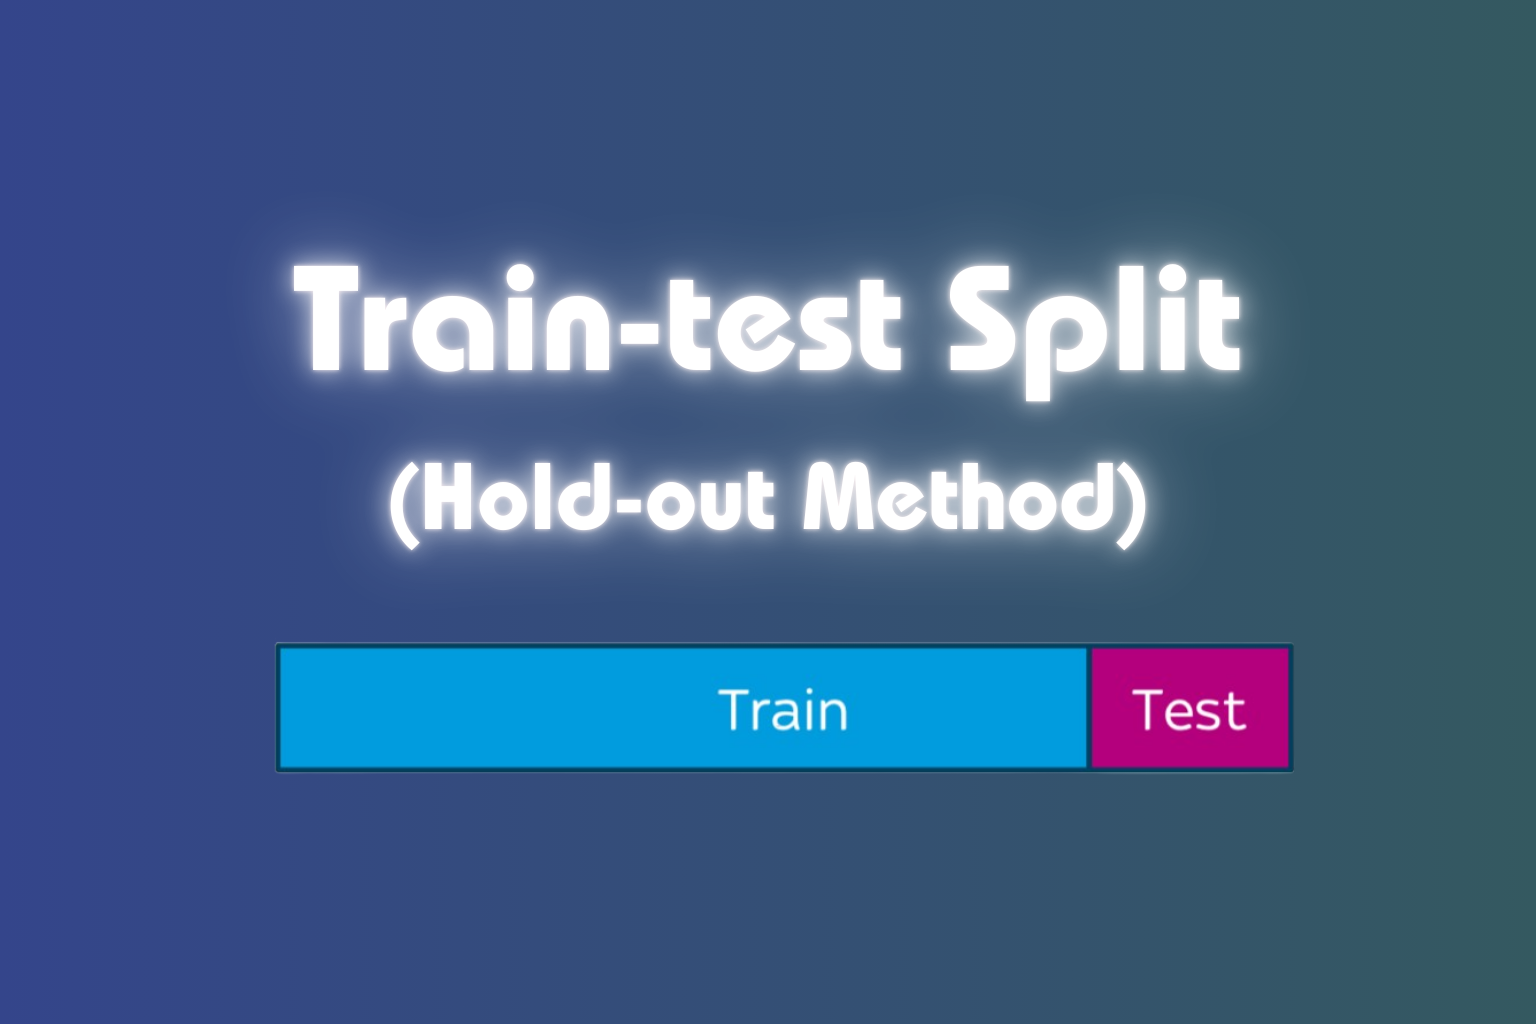
The train–test split, also known as the hold-out method, is the simplest model evaluation technique. You divide your dataset into two independent parts:
- Training Set → to train the model
- Testing Set → to evaluate the model’s performance on unseen data
Common split ratios:
- 80% train / 20% test
- 70% train / 30% test
- 75% train / 25% test
Why Use?
Whenever you build a machine learning model, you must estimate how well it performs on new, unseen data. The hold-out method provides a quick and efficient way to do this.
Use Cases
The hold-out method is ideal when:
-
You have a large dataset
If your dataset is very big, even a single train/test split is enough. -
You need quick results
Useful during early experimentation or baseline model building. -
Training the model is computationally expensive
Examples: deep learning models, large ensemble models. -
When data distribution is stable
If your dataset is well-balanced and large, variance is minimal.
Benefits
-
Simple to Understand
Easiest evaluation method. -
Fast
Only trains 1 model. -
Good for very large datasets
Deep learning models often use this method. -
Easy to adjust split ratio
You can tune the test size based on dataset size.
Limitations
-
High Variance
If the test split is “bad,” performance scores can fluctuate heavily. -
Not suitable for small datasets
Loses too much training data. -
Sensitive to random splits
One random split may not represent the entire data distribution. -
May lead to biased evaluation
Especially if the dataset is unbalanced.
Example
1. From Scratch/Manual:
import numpy as np
# import matplotlib.pyplot as plt

np.random.seed(33)

noise = np.random.normal(0, 5, 50)
X = np.random.uniform(low=1, high=30, size=50) # study hours
y = 3 * X + noise; # scores

X = X.reshape(50, 1) # X = np.reshape(X,(50,1))

index = np.arange(0, 50);
np.random.shuffle(index)

ratio = int(0.8 * len(index))

train_index = index[:ratio]
test_index = index[ratio:]

# print(train_index)
# print(test_index)

X_train = X[train_index]
y_train = y[train_index]

X_test = X[test_index]
y_test = y[test_index]


print("TRAIN SPLIT: \n")
print(X_train)

print("\nX_train Size:", X_train.size)
print("X_train Shape", X_train.shape)

print()
print(y_train)
print("\ny_train Size:", y_train.size)
print("y_train Shape", y_train.shape)


print("\nTEST SPLIT:")
print(X_test)
print("\nX_test Size:", X_test.size)
print("X_test Shape", X_test.shape)

print()
print(y_test)
print("\ny_test Size", y_test.size)
print("y_test Shape", y_test.shape)
Output:
TRAIN SPLIT:

[[24.37777236]
 [21.22634424]
 [20.50900467]
 [10.97995542]
 [20.89644488]
 [25.18607603]
 [15.79563742]
 [24.12718664]
 [ 5.68536795]
 [14.12092061]
 [ 7.84125561]
 [13.2050412 ]
 [18.65926541]
 [29.06131598]
 [ 8.74368184]
 [23.29324339]
 [26.904265  ]
 [26.6787938 ]
 [10.9130364 ]
 [27.04754963]
 [25.48932443]
 [12.27212128]
 [13.86325413]
 [ 5.95873081]
 [20.32582339]
 [13.60132282]
 [13.44204881]
 [12.50965733]
 [11.67854955]
 [25.66947455]
 [29.07130393]
 [24.42272075]
 [10.46204687]
 [28.95226666]
 [27.13759321]
 [17.46970167]
 [29.21306213]
 [ 1.50378875]
 [ 8.97698061]
 [23.13653048]]

X_train Size: 40
X_train Shape (40, 1)

[69.72156851 62.94422548 63.80453511 31.34559874 67.91041853 77.66923638
 51.55177821 61.35193578 18.33047534 50.09291314 16.47979925 36.40783023
 63.07073638 81.03207594 33.66939376 69.39580939 79.62915349 76.37043852
 28.85222809 84.59305361 75.72072359 31.08815788 41.59273379 15.40729048
 62.60267265 36.04787343 40.2447149  29.51406923 38.90646321 74.93524823
 84.18256219 69.07993753 25.96173896 85.82285067 80.28547182 51.29662129
 91.74604341 -3.1647231  36.9848547  64.40855062]

y_train Size: 40
y_train Shape (40,)

TEST SPLIT:
[[17.4225257 ]
 [ 9.29313011]
 [14.5825849 ]
 [ 6.04365544]
 [29.18292268]
 [20.9892105 ]
 [17.26060425]
 [11.82477298]
 [23.74821839]
 [19.94613332]]

X_test Size: 10
X_test Shape (10, 1)

[46.18595802 29.55172448 40.89575023 19.84828003 84.35905256 52.73836469
 52.81105396 29.54531306 70.5005271  68.50989521]

y_test Size 10
y_test Shape (10,)
2. Using Scikit-learn:
import numpy as np
from sklearn.model_selection import train_test_split

np.random.seed(33)
noise = np.random.normal(0, 5, 50)
X = np.random.uniform(low=1, high=30, size=50) # study hours
y = 3 * X + noise; # scores

X_train, X_test, y_train, y_test = train_test_split(
    X, y,
    test_size=0.2,
    random_state=42,
    shuffle=True
)

print("Train size:", X_train.shape[0])
print("Test size:", X_test.shape[0])


print()
print("TRAIN SPLIT:\n")
print("X_train:\n", X_train)
print("\ny_train:\n", y_train)

print("\nTEST SPLIT:\n")
print("X_test:\n", X_test)
print("\ny_test:\n", y_test)
Output:
Train size: 40
Test size: 10

TRAIN SPLIT:

X_train:
 [13.44204881 26.904265   25.66947455 23.29324339 14.5825849  25.48932443
 18.65926541 24.42272075 21.22634424 24.12718664 25.18607603 13.60132282
 13.2050412  26.6787938  17.4225257  10.97995542 11.82477298 17.26060425
 28.95226666  5.68536795  5.95873081 29.18292268 10.9130364  12.50965733
 27.04754963  1.50378875 29.07130393 11.67854955  9.29313011 13.86325413
 27.13759321 20.9892105  23.13653048  8.74368184 14.12092061  8.97698061
 23.74821839 10.46204687 29.21306213 12.27212128]

y_train:
 [40.2447149  79.62915349 74.93524823 69.39580939 40.89575023 75.72072359
 63.07073638 69.07993753 62.94422548 61.35193578 77.66923638 36.04787343
 36.40783023 76.37043852 46.18595802 31.34559874 29.54531306 52.81105396
 85.82285067 18.33047534 15.40729048 84.35905256 28.85222809 29.51406923
 84.59305361 -3.1647231  84.18256219 38.90646321 29.55172448 41.59273379
 80.28547182 52.73836469 64.40855062 33.66939376 50.09291314 36.9848547
 70.5005271  25.96173896 91.74604341 31.08815788]

TEST SPLIT:

X_test:
 [20.89644488 20.32582339  7.84125561 20.50900467 15.79563742 24.37777236
 29.06131598 17.46970167 19.94613332  6.04365544]

y_test:
 [67.91041853 62.60267265 16.47979925 63.80453511 51.55177821 69.72156851
 81.03207594 51.29662129 68.50989521 19.84828003]