Implementing Simple Linear Regression from Scratch
(A Complete Guide with Example and Python Code)
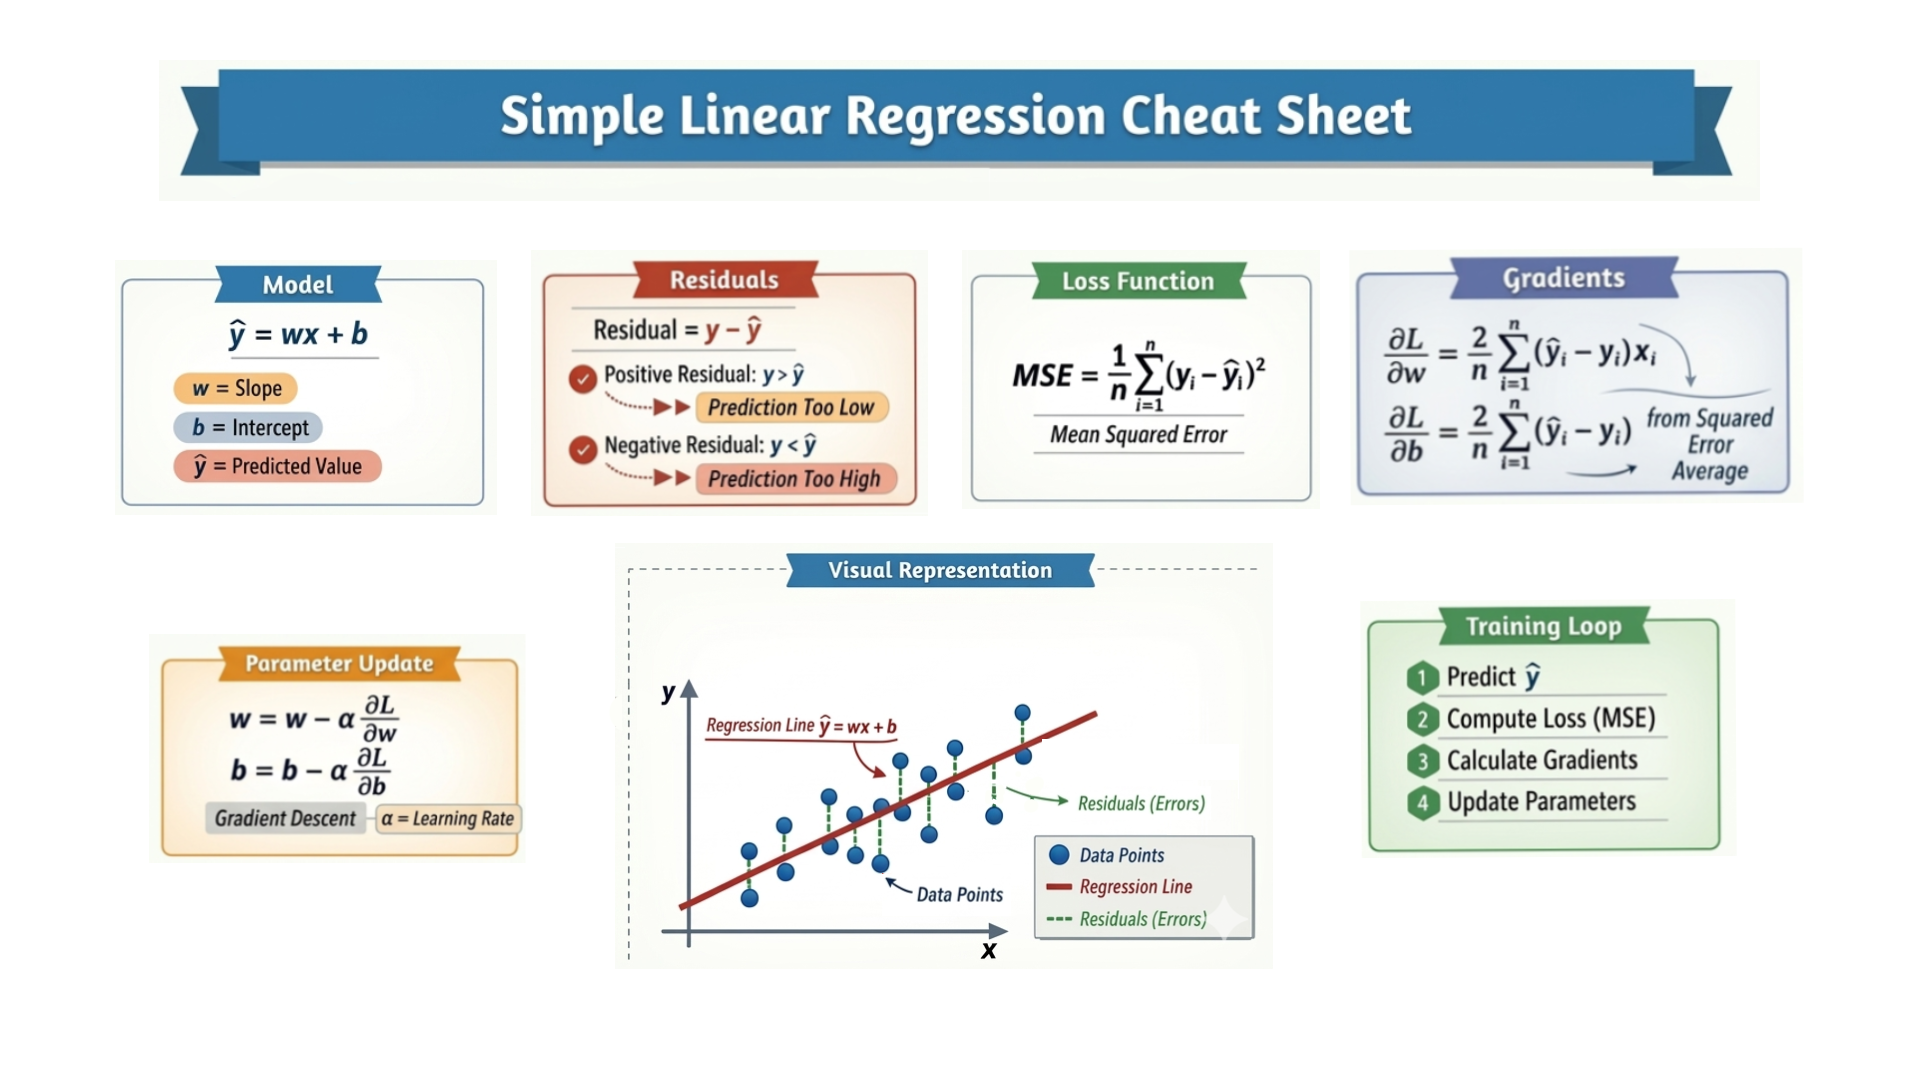
Here are the major steps to implement Simple Linear Regression from scratch.
1. Prepare the Dataset
You start with input–output data.
- X → independent variable (feature)
- y → dependent variable (target)
The goal of the model is to learn the relationship between X and y so that it can predict the target value for new inputs.
2. Define the Model (Linear Equation)
Simple linear regression assumes a straight-line relationship between the input and output:
\[\hat{y} = wx + b\]Where:
- w → weight (slope of the line)
- b → bias (intercept)
- x → input feature
- ŷ → predicted value
Intuition:
- w (slope) controls how steep the line is.
- b (intercept) shifts the line up or down.
- The algorithm adjusts the line so that it passes as close as possible to all data points.
Visually:
- Data → scattered points
- Model → straight line
- Training → moving the line until it fits the points best
3. Initialize Parameters
Before training begins, we start with initial parameter values:
w = 0
b = 0
α = 0.01  # learning rate
Where:
- w → weight
- b → bias
- α → learning rate (controls how large each update step is)
4. Make Predictions
Using the model equation, we compute predictions for each input:
\[\hat{y} = wx + b\]This gives the predicted output for every data point.
5. Understand Residuals
A residual is the difference between the actual value and predicted value:
\[\text{Residual} = y - \hat{y}\]Residuals tell us how wrong each prediction is:
- Positive residual → prediction too small
- Negative residual → prediction too large
6. Calculate the Loss (Error)
We measure how far the predictions are from the true values using Mean Squared Error (MSE):
\[MSE = \frac{1}{n}\sum_{i=1}^{n}(y_i - \hat{y}_i)^2\]Where:
- n = number of samples
- yᵢ = actual value
- ŷᵢ = predicted value
The goal of training is to find values of w and b that minimize this loss, i.e., make residuals as small as possible.
7. Compute Gradients (Derivatives)
To reduce the loss, we calculate how sensitive the loss is to changes in the parameters.
Gradients show how the parameters should change to reduce the loss.
\[\frac{\partial L}{\partial w} = \frac{2}{n}\sum_{i=1}^{n}(\hat{y}_i - y_i)x_i\] \[\frac{\partial L}{\partial b} = \frac{2}{n}\sum_{i=1}^{n}(\hat{y}_i - y_i)\]Why 2/n?
- The MSE is \((\frac{1}{n}\sum (y_i - \hat{y}_i)^2)\)
- Differentiating \(((y_i - \hat{y}_i)^2)\) gives \(2*(ŷ - y)\)
- Multiply by \(1/n\) from the mean → \(2/n\)
This scaling ensures the gradient points in the correct direction and is proportional to the average error.
8. Update Parameters (Gradient Descent)
We update the parameters in the opposite direction of the gradients:
\[w = w - \alpha \frac{\partial L}{\partial w}\] \[b = b - \alpha \frac{\partial L}{\partial b}\]Intuition:
- If prediction > actual → gradient pushes line downward
- If prediction < actual → gradient pushes line upward
The learning rate α controls how big each adjustment is.
9. Repeat for Many Iterations
Each full pass through the dataset is called an epoch.
During each epoch:
- Predict values
- Compute loss
- Compute gradients
- Update parameters
Repeat for many epochs until the loss converges (stops decreasing significantly).
10. Use the Model for Prediction
After training is complete, the model has learned the optimal w and b.
For any new input x:
\[\hat{y} = wx + b\]This allows the model to estimate target values for unseen data.
Final Algorithm (Summary)
- Load dataset \((X, y)\)
- Initialize w, b, and learning rate
- Loop for a number of epochs
- Compute predictions
- Compute residuals and loss (MSE)
- Compute gradients
- Update parameters using gradient descent
- Repeat until loss converges
- Use the trained model for predictions
Linear Regression from Scratch: 5 Iterations of Gradient
Iteration 1
1. Dataset
We have 5 data points:
\[X = [1, \enspace 2, \enspace 3, \enspace 4, \enspace 5], \quad y = [3, \enspace 5, \enspace 7, \enspace 9, \enspace 11]\]We start with initial parameters:
\[w = 0, \quad b = 0\]2. Making Predictions
The predicted values \((\hat{y})\) are calculated using the linear model:
\[\hat{y} = w \cdot X + b\]Substituting \((w=0, b=0)\):
\[\hat{y} = [0\cdot1 + 0, \enspace 0\cdot2 + 0, \enspace 0\cdot3 + 0, \enspace 0\cdot4 + 0, \enspace 0\cdot5 + 0] = [0, 0, 0, 0, 0]\]At this stage, our model predicts all zeros because both weight and bias are zero.
3. Calculating Errors
The error for each data point is:
\[\text{Error} = y - \hat{y}\] \[= [3, 5, 7, 9, 11] - [0, 0, 0, 0, 0] = [3, 5, 7, 9, 11]\]This shows how far off our predictions are from the actual values.
4. Calculating Loss (Mean Squared Error)
We use Mean Squared Error (MSE):
\[J(w, b) = \frac{1}{n} \sum_{i=1}^{n} (\hat{y}_i - y_i)^2\] \[= \frac{1}{5} [(-3)^2 + (-5)^2 + (-7)^2 + (-9)^2 + (-11)^2]\] \[= \frac{1}{5} [9 + 25 + 49 + 81 + 121] = \frac{285}{5} = 57\]This is the “cost” of our model with the current parameters.
5. Calculating Gradients
We compute partial derivatives to know the direction in which to adjust parameters.
A. Gradient w.r.t Weight (w)
\[\frac{\partial J}{\partial w} = \frac{2}{n} \sum_{i=1}^{n} (\hat{y}_i - y_i) x_i\] \[d_w = \frac{2}{5} [(-3\cdot1) + (-5\cdot2) + (-7\cdot3) + (-9\cdot4) + (-11\cdot5)] = \frac{2}{5}(-125) = -50\]Step by step:
\[(-3\cdot1) + (-5\cdot2) + (-7\cdot3) + (-9\cdot4) + (-11\cdot5) = -3 - 10 - 21 - 36 - 55 = -125\] \[d_w = \frac{2}{5}(-125) = -50\]Negative gradient → we need to increase (w) to reduce loss.
B. Gradient w.r.t Bias (b)
\[\frac{\partial J}{\partial b} = \frac{2}{n} \sum_{i=1}^{n} (\hat{y}_i - y_i)\] \[d_b = \frac{2}{5} [(-3) + (-5) + (-7) + (-9) + (-11)] = \frac{2}{5}(-35) = -14\]Step by step:
\[(-3) + (-5) + (-7) + (-9) + (-11) = -35\] \[d_b = \frac{2}{5}(-35) = -14\]Negative gradient → we also need to increase (b) to reduce loss.
6. Updating Parameters
Using gradient descent with learning rate \((\eta = 0.01)\):
\[w = w - \eta \cdot d_w = 0 - 0.01(-50) = 0.5\] \[b = b - \eta \cdot d_b = 0 - 0.01(-14) = 0.14\]After one iteration, the model has learned a little: weight (w = 0.5) and bias (b = 0.14).
Iteration 2
1. Making Predictions
Using updated parameters from Iteration 1:
\[w = 0.5\] \[b = 0.14\]Using the linear model:
\[\hat{y} = w \cdot X + b\]Substituting \((w = 0.5, b = 0.14)\):
\[\hat{y} = [0.5\cdot 1 + 0.14, \enspace 0.5\cdot 2 + 0.14, \enspace 0.5\cdot 3 + 0.14, \enspace 0.5\cdot 4 + 0.14, \enspace 0.5\cdot 5 + 0.14]\] \[= [0.5 + 0.14, \enspace 1.0 + 0.14, \enspace 1.5 + 0.14, \enspace 2.0 + 0.14, \enspace 2.5 + 0.14]\] \[= [0.64, \enspace 1.14, \enspace 1.64, \enspace 2.14, \enspace 2.64]\]The predictions are now slightly closer to the true values, but still far away.
2. Calculating Errors
\[\text{Error} = \hat{y} - y\] \[= [0.64 - 3, \enspace 1.14 - 5, \enspace 1.64 - 7, \enspace 2.14 - 9, \enspace 2.64 - 11]\] \[= [-2.36, -3.86, -5.36, -6.86, -8.36]\]3. Calculating Loss (MSE)
\[J(w, b) = \frac{1}{5} \sum (\hat{y}_i - y_i)^2\] \[= \frac{1}{5} [(-2.36)^2 + (-3.86)^2 + (-5.36)^2 + (-6.86)^2 + (-8.36)^2]\] \[= \frac{1}{5} [5.5696+ 14.8996 + 28.7296 + 47.0596 + 69.8896]\] \[= \frac{1}{5} [166.148]\] \[= 33.2296 \approx 33.23\]Loss has decreased from 57 → 33.23. The model is learning.
4. Calculating Gradients
A. Gradient w.r.t Weight (w)
\[\frac{\partial J}{\partial w}/d_w = \frac{2}{n} \sum_{i=1}^{n} (\hat{y}_i - y_i) x_i\] \[d_w = \frac{2}{5} [(-2.36 \cdot 1) + (-3.86 \cdot 2) + (-5.36 \cdot 3) + (-6.86 \cdot 4) + (-8.36 \cdot 5)]\] \[= \frac{2}{5}(-2.36 - 7.72 - 16.08 - 27.44 - 41.8)\] \[= \frac{2}{5}(-95.4)\] \[= -38.16\]B. Gradient w.r.t Bias (b)
\[\frac{\partial J}{\partial b}/d_b = \frac{2}{n} \sum_{i=1}^{n} (\hat{y}_i - y_i)\] \[= \frac{2}{5} [(-2.36) + (-3.86) + (-5.36) + (-6.86) + (-8.36)]\] \[= \frac{2}{5} [-2.36 - 3.86 - 5.36 - 6.86 - 8.36]\] \[= \frac{2}{5}(-26.8)\] \[= -10.72\]5. Updating Parameters
\((\eta = 0.01)\)
\[w = w - \eta \cdot d_w\] \[= 0.5 - 0.01(-38.16)\] \[= 0.5 + 0.3816\] \[= 0.8816\] \[b = b - \eta \cdot d_b\] \[= 0.14 - 0.01(-10.72)\] \[= 0.14 + 0.1072\] \[= 0.2472\]After iteration 2: \((w = 0.8816, b = 0.2472)\)
Iteration 3
1. Making Predictions
Using updated parameters from Iteration 2:
\[w = 0.8816\] \[b = 0.2472\]Using the linear model:
\[\hat{y} = w \cdot X + b\]Substituting \((w = 0.8816, b = 0.2472)\):
\[\hat{y} = [0.8816\cdot 1 + 0.2472, \enspace 0.8816\cdot 2 + 0.2472, \enspace 0.8816\cdot 3 + 0.2472, \enspace 0.8816\cdot 4 + 0.2472, \enspace 0.8816\cdot 5 + 0.2472]\] \[= [0.8816 + 0.2472, \enspace 1.7632 + 0.2472, \enspace 2.6448 + 0.2472, \enspace 3.5264 + 0.2472, \enspace 4.408 + 0.2472]\]\(= [1.1288, \enspace 2.0104, \enspace 2.892, \enspace 3.7736, \enspace 4.6552]\) \(= [1.1288, \enspace 2.0104, \enspace 2.892, \enspace 3.7736, \enspace 4.6552]\)
The predictions continue moving closer to the actual values.
2. Calculating Errors
\[\text{Error} = \hat{y} - y\] \[= [1.1288 - 3, \enspace 2.0104 - 5, \enspace 2.892 - 7, \enspace 3.7736 - 9, \enspace 4.6552 - 11]\] \[= [-1.8712, -2.9896, -4.108, -5.2264, -6.3448]\]3. Calculating Loss (MSE)
\[J(w, b) = \frac{1}{5} \sum (\hat{y}_i - y_i)^2\] \[= \frac{1}{5} [(-1.8712)^2 + (-2.9896)^2 + (-4.108)^2 + (-5.2264)^2 + (-6.3448)^2]\] \[= \frac{1}{5} [3.50138944 + 8.93770816 + 16.875664 + 27.31424896 + 40.25447104]\] \[= \frac{1}{5} [96.8834816] = 19.37669632 \approx 19.38\]Loss has decreased further, showing the model is improving.
4. Calculating Gradients
A. Gradient w.r.t Weight (w)
\[\frac{\partial J}{\partial w}/d_w = \frac{2}{n} \sum_{i=1}^{n} (\hat{y}_i - y_i) x_i\] \[d_w = \frac{2}{5} [(-1.8712 \cdot 1) + (-2.9896 \cdot 2) + (-4.108 \cdot 3) + (-5.2264 \cdot 4) + (-6.3448 \cdot 5)]\] \[= \frac{2}{5}(-1.8712 - 5.9792 - 12.324 - 20.9056 - 31.724)\] \[= \frac{2}{5}(-72.804) = -29.1216\]B. Gradient w.r.t Bias (b)
\[\frac{\partial J}{\partial b}/d_b = \frac{2}{n} \sum_{i=1}^{n} (\hat{y}_i - y_i)\] \[d_b = \frac{2}{5} [(-1.8712) + (-2.9896) + (-4.108) + (-5.2264) + (-6.3448)]\] \[= \frac{2}{5}(-20.54) = -8.216\]5. Updating Parameters
\[(\eta = 0.01)\] \[w = w - \eta \cdot d_w\] \[= 0.8816 - 0.01(-29.1216)\] \[= 0.8816 + 0.291216\] \[= 1.172816\] \[b = b - \eta \cdot d_b\] \[= 0.2472 - 0.01(-8.216)\] \[= 0.2472 + 0.08216\] \[= 0.32936\]After iteration 3: \((w = 1.172816, b = 0.32936)\)
Iteration 4
1. Making Predictions
Using updated parameters from Iteration 3:
\[w = 1.172816\] \[b = 0.32936\]Using the linear model:
\[\hat{y} = w \cdot X + b\]Substituting \((w = 1.172816, b = 0.32936)\):
\[\hat{y} = [1.172816\cdot 1 + 0.32936, \enspace 1.172816\cdot 2 + 0.32936, \enspace 1.172816\cdot 3 + 0.32936, \enspace 1.172816\cdot 4 + 0.32936, \enspace 1.172816\cdot 5 + 0.32936]\] \[= [1.172816 + 0.32936, \enspace 2.345632 + 0.32936, \enspace 3.518448 + 0.32936, \enspace 4.691264 + 0.32936, \enspace 5.86408 + 0.32936]\] \[= [1.502176, \enspace 2.674992, \enspace 3.847808, \enspace 5.020624, \enspace 6.19344]\]The predictions continue to move closer to the actual values.
2. Calculating Errors
\[\text{Error} = \hat{y} - y\] \[= [1.502176 - 3, \enspace 2.674992 - 5, \enspace 3.847808 - 7, \enspace 5.020624 - 9, \enspace 6.19344 - 11]\] \[= [-1.497824, -2.325008, -3.152192, -3.979376, -4.80656]\]3. Calculating Loss (MSE)
\[J(w, b) = \frac{1}{5} \sum (\hat{y}_i - y_i)^2\] \[= \frac{1}{5} [(-1.497824)^2 + (-2.325008)^2 + (-3.152192)^2 + (-3.979376)^2 + (-4.80656)^2]\] \[= \frac{1}{5} [2.24347671 + 5.4056622 + 9.93631439 + 15.83543328 + 23.10301879]\] \[= \frac{1}{5} [56.52390537]\] \[= 11.30478107 \approx 11.30\]Loss continues decreasing, indicating the model is learning the correct relationship.
4. Calculating Gradients
A. Gradient w.r.t Weight (w)
\[\frac{\partial J}{\partial w}/d_w = \frac{2}{n} \sum_{i=1}^{n} (\hat{y}_i - y_i) x_i\] \[d_w = \frac{2}{5} [(-1.497824 \cdot 1) + (-2.325008 \cdot 2) + (-3.152192 \cdot 3) + (-3.979376 \cdot 4) + (-4.80656 \cdot 5)]\] \[= \frac{2}{5}(-1.497824 - 4.650016 - 9.456576 - 15.917504 - 24.0328)\] \[= \frac{2}{5}(-55.55472)\] \[= -22.221888\]B. Gradient w.r.t Bias (b)
\[\frac{\partial J}{\partial b}/d_b = \frac{2}{n} \sum_{i=1}^{n} (\hat{y}_i - y_i)\] \[d_b = \frac{2}{5} [(-1.497824) + (-2.325008) + (-3.152192) + (-3.979376) + (-4.80656)]\] \[= \frac{2}{5}(-15.761)\] \[= -6.304384\]5. Updating Parameters
\[(\eta = 0.01)\] \[w = w - \eta \cdot d_w\] \[= 1.172816 - 0.01(-22.221888)\] \[= 1.172816 + 0.22221888\] \[= 1.39503488\] \[b = b - \eta \cdot d_b\] \[= 0.32936 - 0.01(-6.304384)\] \[= 0.32936 + 0.06304384\] \[= 0.39240384\]After iteration 4: \((w = 1.39503488, b = 0.39240384)\)
Iteration 5
1. Making Predictions
Using updated parameters from Iteration 4:
\[w = 1.39503488\] \[b = 0.39240384\]Using the linear model:
\[\hat{y} = w \cdot X + b\]Substituting \((w = 1.39503488, b = 0.39240384)\):
\[\hat{y} = [1.39503488\cdot 1 + 0.39240384, \enspace 1.39503488\cdot 2 + 0.39240384, \enspace 1.39503488\cdot 3 + 0.39240384, \enspace 1.39503488\cdot 4 + 0.39240384, \enspace 1.39503488\cdot 5 + 0.39240384]\] \[= [1.39503488 + 0.39240384, \enspace 2.79006976 + 0.39240384, \enspace 4.18510464 + 0.39240384, \enspace 5.58013952 + 0.39240384, \enspace 6.9751744 + 0.39240384]\] \[= [1.78743872, \enspace 3.1824736, \enspace 4.57750848, \enspace 5.97254336, \enspace 7.36757824]\]The predictions are getting closer to the true values.
2. Calculating Errors
\[\text{Error} = \hat{y} - y\] \[= [1.78743872 - 3, \enspace 3.1824736 - 5, \enspace 4.57750848 - 7, \enspace 5.97254336 - 9, \enspace 7.36757824 - 11]\] \[= [-1.21256128, -1.8175264, -2.42249152, -3.02745664, -3.63242176]\]3. Calculating Loss (MSE)
\[J(w, b) = \frac{1}{5} \sum (\hat{y}_i - y_i)^2\] \[= \frac{1}{5} [(-1.21256128)^2 + (-1.8175264)^2 + (-2.42249152)^2 + (-3.02745664)^2 + (-3.63242176)^2]\] \[= \frac{1}{5} [1.47030504 + 3.30340191 + 5.86846117 + 9.16548284 + 13.19446689]\] \[= \frac{1}{5} [33.00211785]\] \[= 6.60042357 \approx 6.60\]Loss keeps decreasing as the model parameters improve.
4. Calculating Gradients
A. Gradient w.r.t Weight (w)
\[\frac{\partial J}{\partial w}/d_w = \frac{2}{n} \sum_{i=1}^{n} (\hat{y}_i - y_i) x_i\] \[d_w = \frac{2}{5} [(-1.21256128 \cdot 1) + (-1.8175264 \cdot 2) + (-2.42249152 \cdot 3) + (-3.02745664 \cdot 4) + (-3.63242176 \cdot 5)]\] \[= \frac{2}{5}(-1.21256128 - 3.6350528 - 7.26747456 - 12.10982656 - 18.1621088)\] \[= \frac{2}{5}(-42.387024)\] \[= -16.9548096\]B. Gradient w.r.t Bias (b)
\[\frac{\partial J}{\partial b}/d_b = \frac{2}{n} \sum_{i=1}^{n} (\hat{y}_i - y_i)\] \[d_b = \frac{2}{5} [(-1.21256128) + (-1.8175264) + (-2.42249152) + (-3.02745664) + (-3.63242176)]\] \[= \frac{2}{5}(-12.1124576)\] \[= -4.84498304\]5. Updating Parameters
\[(\eta = 0.01)\] \[w = w - \eta \cdot d_w\] \[= 1.39503488 - 0.01(-16.9548096)\] \[= 1.39503488 + 0.169548096\] \[= 1.564582976\] \[b = b - \eta \cdot d_b\] \[= 0.39240384 - 0.01(-4.84498304)\] \[= 0.39240384 + 0.0484498304\] \[= 0.4408536704\]After iteration 5: \((w = 1.564582976, b = 0.4408536704)\)
Python Implementation
import numpy as np
import matplotlib.pyplot as plt

# Dataset
X = np.array([1, 2, 3, 4, 5], dtype=float)
y = np.array([3, 5, 7, 9, 11], dtype=float)

# Parameters
weights = 0.0
bias = 0.0
learning_rate = 0.01
epochs = 15
n = len(X)

# Store MSE for plotting
mse_list = []

# Print table header
print(f"{'Epoch':^5} | {'Init W':^8} | {'Init B':^8} | {'Pred y':^27}    | {'MSE':^10} | {'Grad W':^10} | {'Grad B':^10} | {'Upd W':^8} | {'Upd B':^8}")
print("-"*120)

plt.figure(figsize=(15,8))

for i in range(epochs):
    # Store initial weights/bias for table
    init_w = weights
    init_b = bias

    # Prediction
    y_pred = weights * X + bias

    # MSE
    mse = np.mean((y_pred - y) ** 2)
    mse_list.append(mse)

    # Gradients
    dw = (2/n) * np.sum((y_pred - y) * X)
    db = (2/n) * np.sum(y_pred - y)

    # Update parameters
    weights -= learning_rate * dw
    bias -= learning_rate * db

    # Round predicted values for display
    y_pred_str = "[" + ", ".join(f"{v:.2f}" for v in y_pred) + "]"

    # Print table row
    print(f"{i+1:^5} | {init_w:^8.4f} | {init_b:^8.4f} | {y_pred_str:^27} | {mse:^10.4f} | {dw:^10.4f} | {db:^10.4f} | {weights:^8.4f} | {bias:^8.4f}")

    # Plot predictions every 5 epochs + first epoch
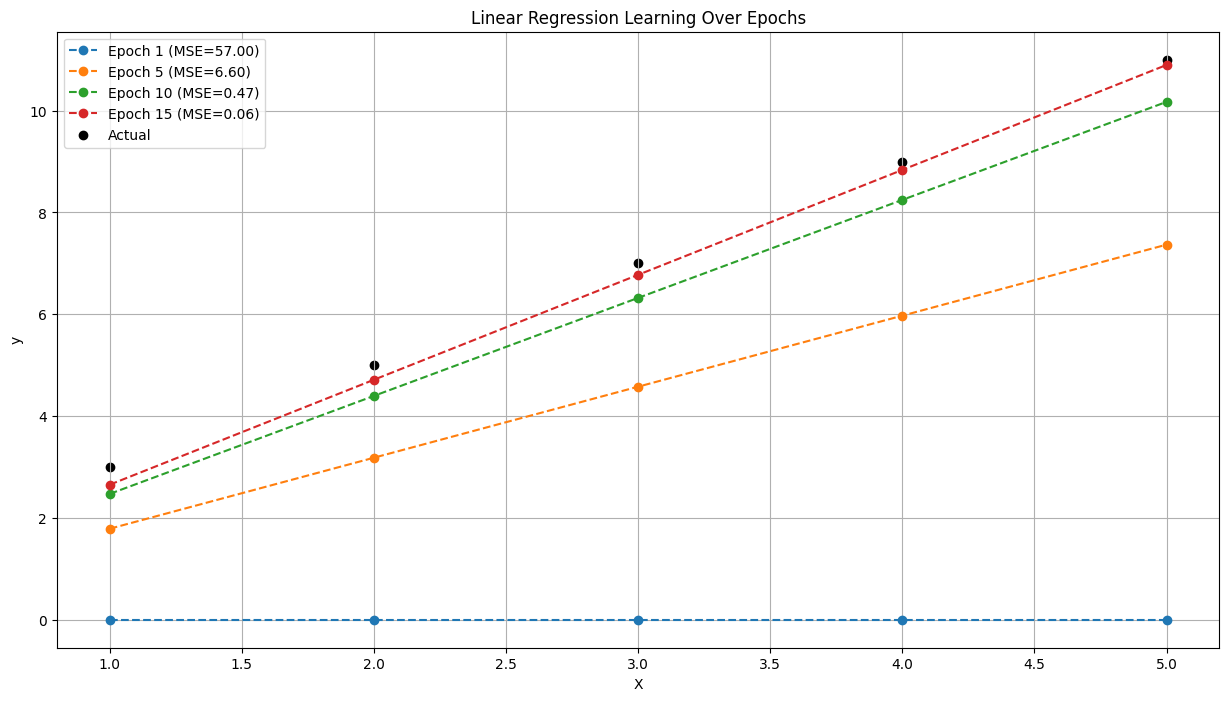
    if (i+1) % 5 == 0 or i == 0:
        plt.plot(X, y_pred, marker='o', linestyle='--', label=f'Epoch {i+1} (MSE={mse:.2f})')

# Plot actual data
plt.scatter(X, y, color='black', label='Actual')
plt.xlabel('X')
plt.ylabel('y')
plt.title('Linear Regression Learning Over Epochs')
plt.legend()
plt.grid(True)
plt.show()

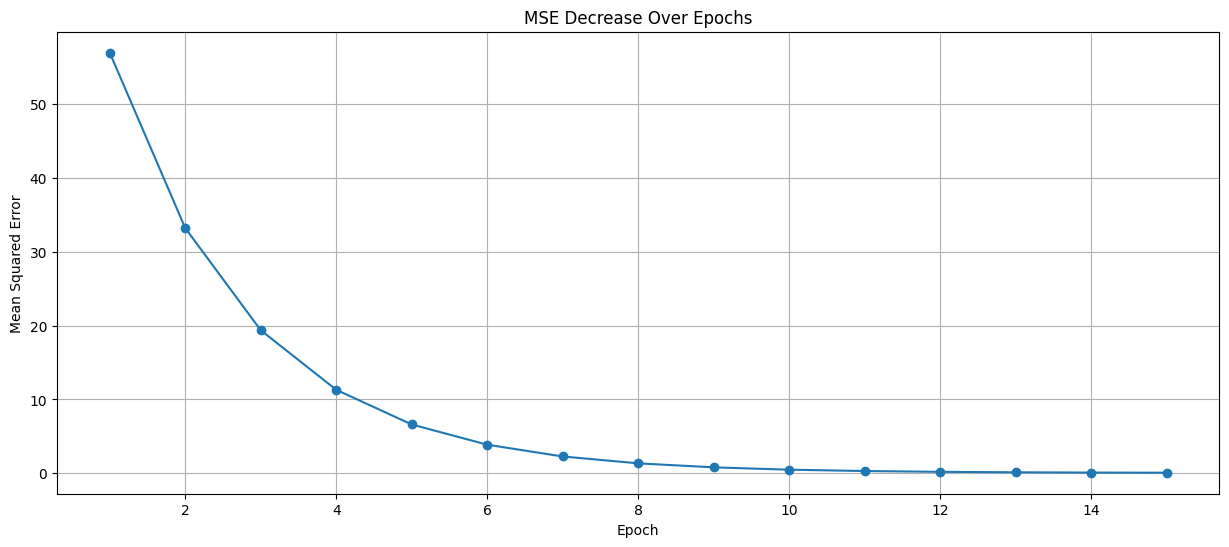
# Plot MSE over epochs
plt.figure(figsize=(15,6))
plt.plot(range(1, epochs+1), mse_list, marker='o', linestyle='-')
plt.xlabel('Epoch')
plt.ylabel('Mean Squared Error')
plt.title('MSE Decrease Over Epochs')
plt.grid(True)
plt.show()
Oputput:
Epoch |  Init W  |  Init B  |           Pred y               |    MSE     |   Grad W   |   Grad B   |  Upd W   |  Upd B
------------------------------------------------------------------------------------------------------------------------
  1   |  0.0000  |  0.0000  | [0.00, 0.00, 0.00, 0.00, 0.00] |  57.0000   |  -50.0000  |  -14.0000  |  0.5000  |  0.1400
  2   |  0.5000  |  0.1400  | [0.64, 1.14, 1.64, 2.14, 2.64] |  33.2296   |  -38.1600  |  -10.7200  |  0.8816  |  0.2472
  3   |  0.8816  |  0.2472  | [1.13, 2.01, 2.89, 3.77, 4.66] |  19.3773   |  -29.1216  |  -8.2160   |  1.1728  |  0.3294
  4   |  1.1728  |  0.3294  | [1.50, 2.67, 3.85, 5.02, 6.19] |  11.3048   |  -22.2219  |  -6.3044   |  1.3950  |  0.3924
  5   |  1.3950  |  0.3924  | [1.79, 3.18, 4.58, 5.97, 7.37] |   6.6004   |  -16.9548  |  -4.8450   |  1.5646  |  0.4409
  6   |  1.5646  |  0.4409  | [2.01, 3.57, 5.13, 6.70, 8.26] |   3.8589   |  -12.9341  |  -3.7308   |  1.6939  |  0.4782
  7   |  1.6939  |  0.4782  | [2.17, 3.87, 5.56, 7.25, 8.95] |   2.2612   |  -9.8647   |  -2.8801   |  1.7926  |  0.5070
  8   |  1.7926  |  0.5070  | [2.30, 4.09, 5.88, 7.68, 9.47] |   1.3300   |  -7.5217   |  -2.2307   |  1.8678  |  0.5293
  9   |  1.8678  |  0.5293  | [2.40, 4.26, 6.13, 8.00, 9.87] |   0.7873   |  -5.7331   |  -1.7347   |  1.9251  |  0.5466
 10   |  1.9251  |  0.5466  | [2.47, 4.40, 6.32, 8.25, 10.17] |   0.4709   |  -4.3677   |  -1.3561   |  1.9688  |  0.5602
 11   |  1.9688  |  0.5602  | [2.53, 4.50, 6.47, 8.44, 10.40] |   0.2865   |  -3.3254   |  -1.0669   |  2.0020  |  0.5708
 12   |  2.0020  |  0.5708  | [2.57, 4.57, 6.58, 8.58, 10.58] |   0.1789   |  -2.5298   |  -0.8460   |  2.0273  |  0.5793
 13   |  2.0273  |  0.5793  | [2.61, 4.63, 6.66, 8.69, 10.72] |   0.1162   |  -1.9225   |  -0.6773   |  2.0466  |  0.5861
 14   |  2.0466  |  0.5861  | [2.63, 4.68, 6.73, 8.77, 10.82] |   0.0795   |  -1.4589   |  -0.5484   |  2.0612  |  0.5916
 15   |  2.0612  |  0.5916  | [2.65, 4.71, 6.78, 8.84, 10.90] |   0.0581   |  -1.1051   |  -0.4499   |  2.0722  |  0.5961
Charts: