Correlation — Statistics & NumPy
(Measuring the Strength and Direction of Relationships)
1. Introduction
While covariance tells us whether two variables move together, correlation tells us how strongly and how consistently they move together.
Correlation standardizes covariance into a dimensionless measure between -1 and +1, allowing us to compare relationships even if the variables have different units or scales.
It is one of the most widely used concepts in statistics, data analysis, and machine learning — especially for understanding feature relationships and dependencies.
2. Intuitive Understanding
Let’s recall:
- Covariance can be any value (e.g., 8, -20, 0.3) depending on the units of measurement.
- Correlation, on the other hand, always lies between -1 and +1, making it easy to interpret.
Example:
| Correlation Value | Interpretation |
|---|---|
| +1 | Perfect positive linear relationship |
| -1 | Perfect negative linear relationship |
| 0 | No linear relationship |
3. Mathematical Definition
For two variables ( X ) and ( Y ):
\[r_{XY} = \frac{\text{Cov}(X, Y)}{\sigma_X \cdot \sigma_Y}\]where:
- \(\text{Cov}(X, Y)\) = covariance of X and Y
- \(\sigma_X\) = standard deviation of X
- \(\sigma_Y\) = standard deviation of Y
So correlation is simply the normalized covariance.
4. Step-by-Step Example (Manual Calculation)
Let’s take two datasets:
\[X = [2, 4, 6, 8, 10]\] \[Y = [1, 3, 5, 7, 9]\]We’ve already computed:
\[\text{Cov}(X, Y) = 8\]Now find the standard deviations:
\[\sigma_X = \sqrt{8} = 2.828, \quad \sigma_Y = \sqrt{8} = 2.828\]Then:
\[r_{XY} = \frac{8}{2.828 \times 2.828} = 1\]Correlation = +1 → perfect positive linear relationship.
5. Interpretation
| Value of r | Relationship Type | Description |
|---|---|---|
| +1 | Perfect positive | Variables move together exactly. |
| +0.7 to +0.9 | Strong positive | As one increases, the other tends to increase strongly. |
| +0.3 to +0.6 | Moderate positive | Variables increase together moderately. |
| 0 | None | No linear relationship. |
| -0.3 to -0.6 | Moderate negative | As one increases, the other tends to decrease. |
| -0.7 to -0.9 | Strong negative | Strong inverse relationship. |
| -1 | Perfect negative | One variable increases while the other decreases perfectly. |
6. Covariance vs Correlation
| Aspect | Covariance | Correlation |
|---|---|---|
| Definition | Average product of deviations | Normalized covariance |
| Units | Product of units of X and Y | Unitless |
| Range | \(-\infty, +\infty\) | \([-1, +1]\) |
| Interpretation | Shows direction | Shows direction and strength |
| Scale-dependent | Yes | No |
In summary:
Correlation = Standardized Covariance
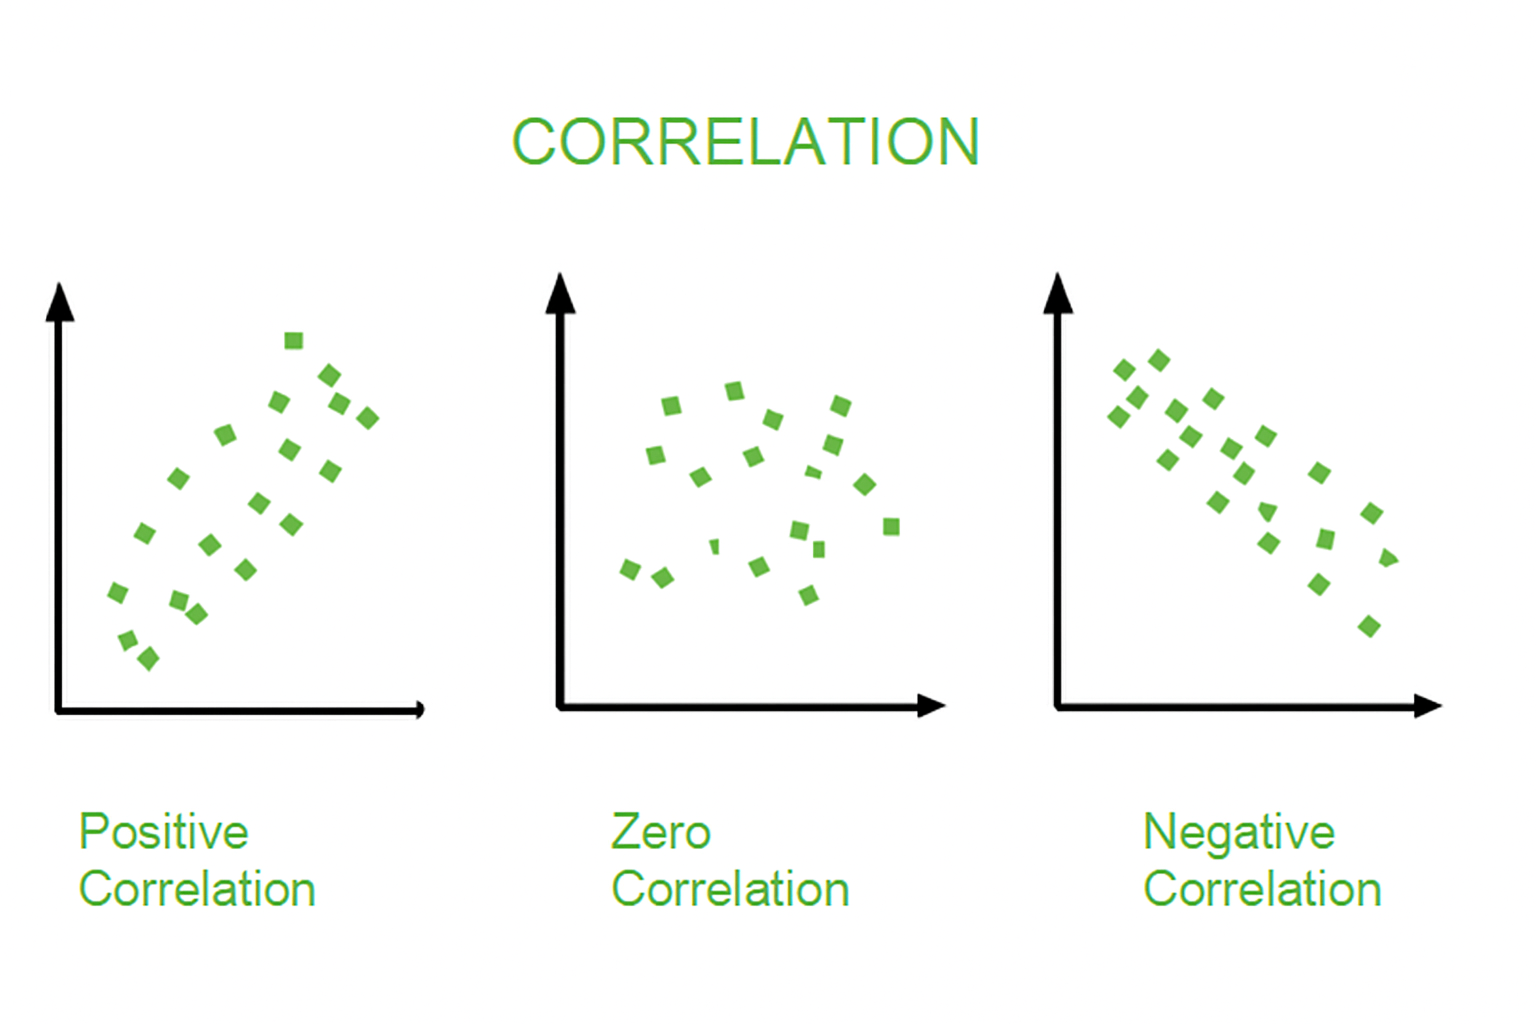
7. Types of Correlation
- Positive Correlation
- Both variables increase or decrease together.
- Example: Height and weight.
- Negative Correlation
- One increases while the other decreases.
- Example: Speed and travel time.
- Zero Correlation
- No linear relationship.
- Example: Shoe size and IQ.
8. NumPy Implementation — np.corrcoef()
NumPy provides an easy way to compute correlation coefficients and correlation matrices.
Example 1: Simple Correlation
import numpy as np

X = np.array([2, 4, 6, 8, 10])
Y = np.array([1, 3, 5, 7, 9])

corr_matrix = np.corrcoef(X, Y)
print("Correlation Matrix:\n", corr_matrix)
Output:
Correlation Matrix:
[[1. 1.]
 [1. 1.]]
The correlation between X and Y is +1, confirming a perfect positive relationship.
Example 2: Slightly Imperfect Relationship
X = np.array([1, 2, 3, 4, 5])
Y = np.array([2, 2.9, 3.8, 4.3, 5.1])

corr_matrix = np.corrcoef(X, Y)
print("Correlation Matrix:\n", corr_matrix)
Output:
Correlation Matrix:
[[1.         0.99124071]
 [0.99124071 1.        ]]
The correlation coefficient ≈ 0.99 → very strong positive relationship.
9. Visual Understanding
Imagine a scatter plot:
- Perfect Positive (r = +1) → points lie on an upward straight line.
- Perfect Negative (r = -1) → points lie on a downward straight line.
- Zero Correlation (r ≈ 0) → points are scattered randomly, with no pattern.
10. Real-Life Applications
- Finance: Relation between two stock prices or returns.
- Machine Learning: Feature correlation to detect redundancy.
- Health Science: Relation between exercise hours and blood pressure.
- Psychology: Relationship between stress level and productivity.
11. Key Takeaways
| Concept | Description |
|---|---|
| Correlation | Measures the strength and direction of linear relationships. |
| Formula | \(r_{XY} = \frac{\text{Cov}(X, Y)}{\sigma_X \cdot \sigma_Y}\) |
| Range | \([-1, +1]\) |
| Interpretation | +1 → Perfect positive correlation 0 → No linear relationship -1 → Perfect negative correlation |
| Strong Relationship | \(r > 0.7\) |
| Function | np.corrcoef(X, Y) in NumPy |
| Unit | None (dimensionless) |
12. Summary
- Covariance shows direction of movement.
- Correlation shows direction + strength, and is scale-independent.
- It is the normalized form of covariance.
- In NumPy,
np.corrcoef()provides fast correlation computation.
In short:
Correlation = Covariance / (Standard deviation of X × Standard deviation of Y)