Covariance — Statistics & NumPy
(Measuring How Two Variables Move Together)
1. Introduction
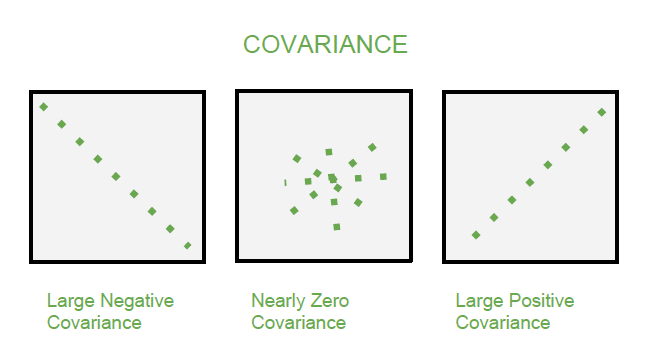
The Covariance is a statistical measure that describes the direction of the linear relationship between two variables.
It tells us whether two variables increase or decrease together (positive relationship), or whether one increases while the other decreases (negative relationship).
It is a fundamental concept in data analysis, finance, and machine learning — especially useful in understanding how different features or datasets move with respect to each other.
2. Intuitive Understanding
Let’s consider two variables:
- \(X\): Number of hours studied
- \(Y\): Marks scored
If students who study more hours tend to get higher marks, then both \(X\) and \(Y\) increase together — meaning their covariance is positive.
If, on the other hand, more hours studied led to lower marks (for example, because of fatigue or overstudying), then \(X\) increases but \(Y\) decreases — meaning their covariance is negative.
If there’s no consistent relationship, covariance will be near zero.
3. Mathematical Definition
For two variables \(X = [x_1, x_2, ..., x_N]\) and \(Y = [y_1, y_2, ..., y_N]\):
\[\text{Cov}(X, Y) = \frac{1}{N} \sum_{i=1}^{N} (x_i - \bar{X})(y_i - \bar{Y})\]For sample covariance, divide by \(N - 1\) instead of \(N\):
\[s_{XY} = \frac{1}{N - 1} \sum_{i=1}^{N} (x_i - \bar{X})(y_i - \bar{Y})\]where:
- \(\bar{X}\) = mean of X
- \(\bar{Y}\) = mean of Y
- \(N\) = number of data points
4. Example Calculation by Hand
Let’s take two datasets:
\[X = [2, 4, 6, 8, 10]\] \[Y = [1, 3, 5, 7, 9]\]-
Mean of X and Y:
\[\bar{X} = 6, \quad \bar{Y} = 5\] -
Deviations:
\[X - \bar{X} = [-4, -2, 0, 2, 4]\] \[Y - \bar{Y} = [-4, -2, 0, 2, 4]\] -
Multiply deviations pairwise and sum:
\[\sum (x_i - \bar{X})(y_i - \bar{Y}) = 40\] -
Divide by N (for population):
\[\text{Cov}(X, Y) = \frac{40}{5} = 8\]
Covariance = +8 (positive) → both variables increase together.
5. Interpretation
| Covariance Value | Relationship | Interpretation |
|---|---|---|
| \(> 0\) | Positive | When one variable increases, the other tends to increase too. |
| \(( < 0\) | Negative | When one variable increases, the other tends to decrease. |
| \(\approx 0\) | None | No linear relationship between the variables. |
Note that covariance measures direction, not strength.
That’s what correlation is used for — we’ll cover that next.
6. NumPy Implementation — np.cov()
NumPy provides a simple and efficient way to calculate covariance matrices.
Example 1: Basic Covariance
import numpy as np

X = np.array([2, 4, 6, 8, 10])
Y = np.array([1, 3, 5, 7, 9])

cov_matrix = np.cov(X, Y, bias=True)   # population covariance
print("Covariance Matrix:\n", cov_matrix)
Output:
Covariance Matrix:
[[8. 8.]
 [8. 8.]]
- The diagonal elements (
[0,0]and[1,1]) are the variances ofXandY. - The off-diagonal elements (
[0,1]and[1,0]) are the covariance betweenXandY.
So, Cov(X, Y) = 8, which matches our manual calculation.
Example 2: Sample Covariance (default)
np.cov(X, Y)
By default, NumPy divides by ( N-1 ) (sample covariance).
To divide by ( N ) (population), set bias=True.
7. Covariance Matrix Explained
For two variables ( X ) and ( Y ), the covariance matrix is:
\[\begin{bmatrix} \text{Var}(X) & \text{Cov}(X, Y) \\ \text{Cov}(Y, X) & \text{Var}(Y) \end{bmatrix}\]Example Output:
[[8. 8.]
 [8. 8.]]
This shows that:
- Variance of X = 8
- Variance of Y = 8
- Cov(X, Y) = 8
- Cov(Y, X) = 8
8. Real-Life Example
Imagine comparing:
- \(X\): Amount of rainfall (mm)
- \(Y\): Crop yield (tons)
If more rain generally means higher yield, covariance will be positive.
If excessive rain reduces yield (flooding, for example), covariance will be negative.
If rain has no consistent effect, covariance will be close to zero.
9. Key Takeaways
| Concept | Description |
|---|---|
| Covariance | Measures direction of linear relationship between variables |
| Positive Covariance | Both increase or decrease together |
| Negative Covariance | One increases while the other decreases |
| Zero Covariance | No linear relationship |
| Formula | \(\text{Cov}(X, Y) = \frac{1}{N}\sum(x_i - \bar{x})(y_i - \bar{y})\) |
| NumPy Function | np.cov(X, Y) |
10. Summary
- Covariance tells us how two variables change together.
- Sign (positive/negative) shows the direction of relationship.
- It does not tell the strength — that’s where Correlation comes in.
- In Python,
np.cov()gives both single covariance values and full covariance matrices.